- US ECI stole the show as markets ignored Canadian GDP
- Canada’s economy is tracking a solid rebound in Q1…
- …that caught the BoC flat-footed…
- …even with less positive data than anticipated
- February’s details were better than the GDP headline
- Be careful tracking GDP relative to the BoC’s revised forecast for 2.8% Q1 growth
- What remains on the path to the June 5th BoC decision
- Canadian GDP m/m %, SA, February:
- Actual: 0.15
- Scotia: 0.4
- Consensus: 0.3
- Prior: 0.5 (revised from 0.6)
- March ‘flash’ estimate: “essentially unchanged”
Well apparently, it’s not Canada’s economy that matters one bit to markets. A simultaneously released measure of US employment costs stole the show. The result was that Canada’s shorter-term market yields followed the US higher and CAD depreciated by half a penny to the USD post-data on both sides of the border. Markets are interpreting another hot sign of US inflationary pressures from the labour market as added reason to forget about the Fed easing any time soon which makes it more challenging for the BoC to deliver material easing—even if it proves to be warranted which remains highly debatable.
US Employment Costs Continue Rapid Growth
We can get the US employment cost index out of the way first. It was up by 1.2% q/q SA nonannualized which was hotter than the 1.0% consensus and all estimates within it (chart 1). For quite a while now it has been wages and salaries (ie: direct cash comp) driving the overall ECI, not benefits.
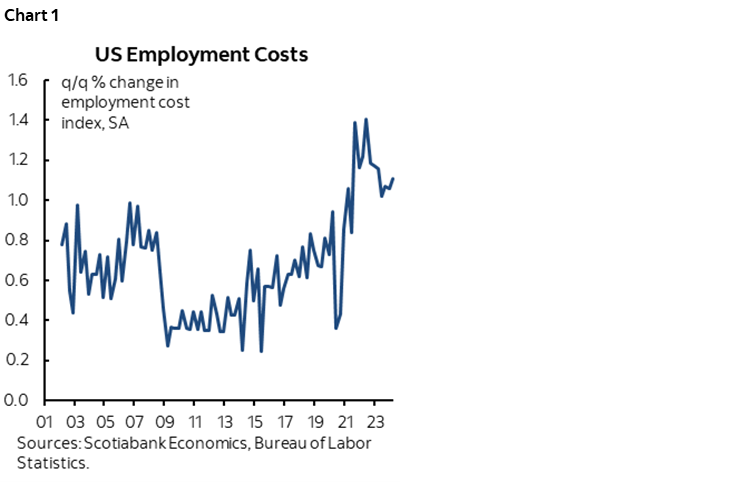
This kind of growth in employment costs requires strong productivity growth to pay for it without sparking inflation risk. Q1 productivity growth arrives on Thursday and is expected to slow to a crawl. We’ll also get unit labour costs at the same time on Thursday and since they measure productivity-adjusted labour costs they are likely to come on strong.
The US also released mixed data including a much stronger gain in a pair of repeat sales house price figures for February and a sharp drop in consumer confidence, but markets largely looked through those releases and stuck with the ECI reaction.
Less Buoyant Monthly GDP Is Still Driving a Strong Rebound
February GDP landed at +0.15% m/m SA which is markedly lower than Statcan’s preliminary ‘flash’ guidance that was provided on March 31st when they said they were tracking growth of 0.4%. So much for advance guidance, but the details were a little better than the headline (see below).
March GDP was guided by Statcan to be “essentially unchanged” which can mean probably anything from -0.1% to +0.1% and there may be high revision risk around that estimate as well.
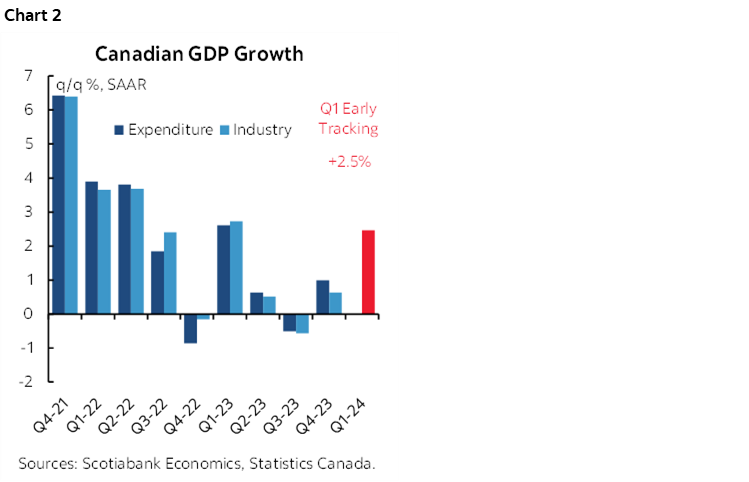
Furthermore, January GDP was revised a touch lower to 0.5% from 0.6% m/m previously. Chart 2 shows the net effect on Q1 GDP tracking with big caveats I’ll come back to.
February GDP was Better Than the Headline, March Might Have Been As Well
Charts 3 and 4 show the unweighted breakdown of GDP growth by sector and the weighted contributions to GDP growth by sector for the month of February respectively.
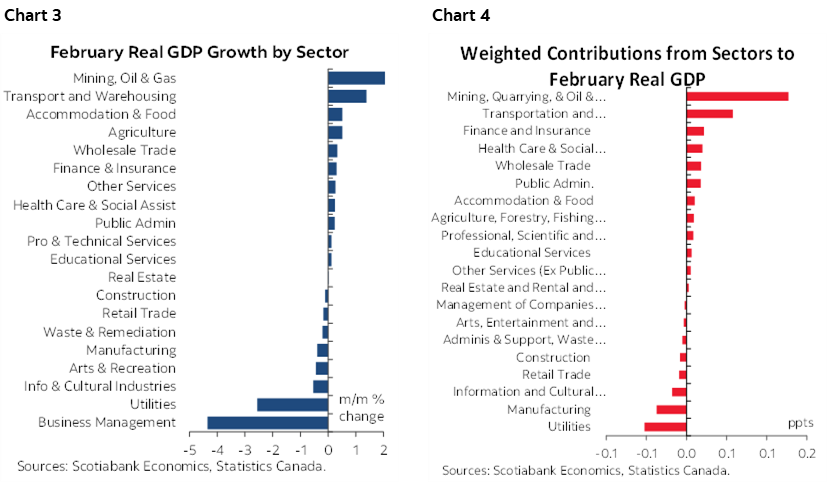
Take out utilities as just a weather report and GDP was up 0.3% m/m in February which is very solid after 0.5% growth in January.
As for March being flat, be careful, there may be difficulty doing seasonal adjustments for the fact that Good Friday/Easter was earlier than is typical. Depending on the industry, that meant 1–3 fewer days of activity/production compared to a 'normal' March which could easily be a big deal to tracking m/m % changes.
Tracking Q1 GDP Growth
We need to be careful drawing conclusions about how growth is tracking relative to the BoC’s expectations using these accounts and I’ll explain why.
As a first step, the sum total of all of that gives us tracking of 2.5% q/q SAAR GDP growth in Q1 but with strong cautions.
One is that we still face a lot of data to come including a firmed up estimate for March that will be informed by readings for the month as they roll in.
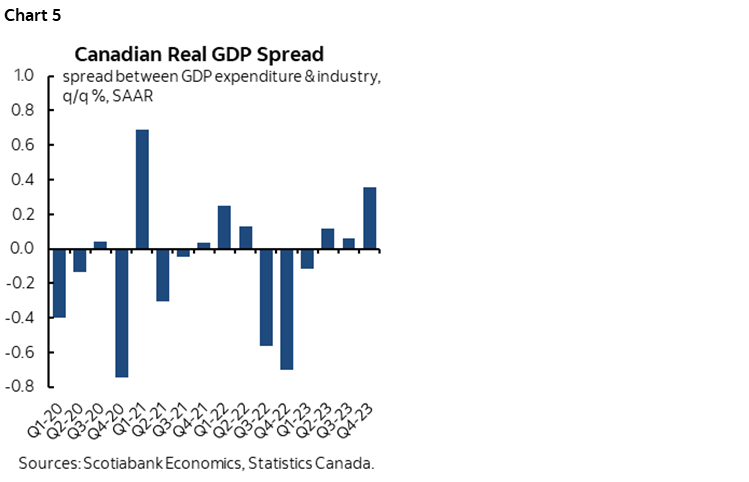
A second caution is that this 2.5% tracking is using monthly production-side GDP accounts that may or may not line-up with forecasts—including those from the BoC—that use expenditure-based GDP. The BoC’s Q1 forecast using expenditure-based GDP was for 2.8% q/q SAAR GDP growth. There can be significant deviations between the two concepts in either direction. The monthly accounts don’t tend to consider how higher or lower output was achieved whereas the expenditure accounts include inventory and net trade effects on growth for which we continue to have limited tracking.
Over time, the two sets of accounts track each other usually within about 0.5 ppts of one another but there can be times marked by even bigger deviations in either direction (chart 5).
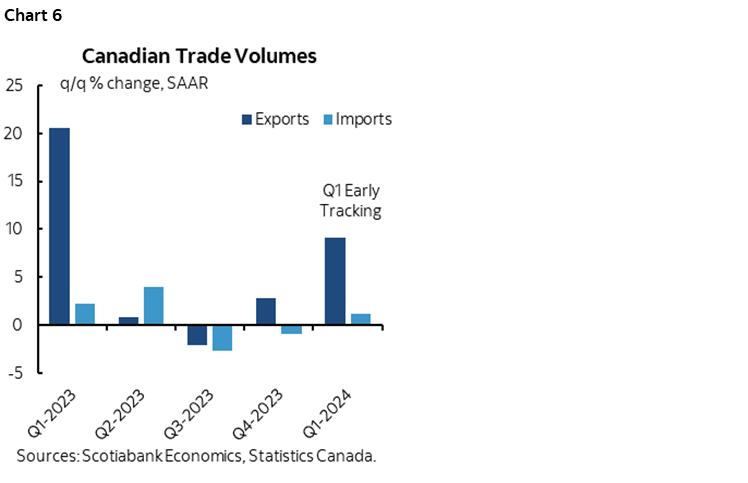
In which direction any tracking differences may turn out to be this time is hard to tell. So far, net trade is tracking a strong contribution to Q1 GDP growth given a surge in export volumes and little change in import volumes (chart 6). This net trade effect could contribute over two percentage points to GDP growth in Q1 on an expenditure basis.
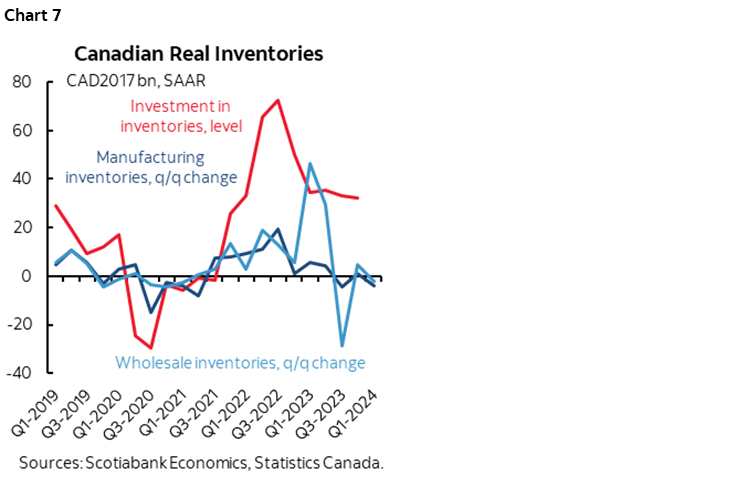
The wildcard is inventory investment. We can’t track retail, resource or farm inventories with higher frequency data and can only track manufacturing and wholesale inventories. Those two sectors may be tracking slightly more inventory disinvestment in Q1 compared to the prior quarter (chart 7), but it’s only up to February and again this misses so much of the inventory picture that we’ll only find out when we get the full set of Q1 GDP accounts.
The moral of the story in terms of esoteric GDP accounting is to reserve some judgement toward how Q1 expenditure-based GDP lines up with the BoC’s April MPR forecast. Be wary of headlines that scream out with confidence that growth is tracking a few tenths lower than the BoC forecast because we can’t say that with much if any confidence.
No Momentum Into Q2
Q2 has 0% q/q SAAR baked in which is solely based upon the monthly GDP accounts and only a momentum argument. It's only based on the Q1 average and the way Q1 ended given preliminary guidance for March. It's neither here nor there in terms of tracking for Q2 GDP growth, leaving us to track incoming Q2 data with neutral momentum.
The Data Versus Missing The Plot
Anyway, let's not get so stuck in the data that we collectively miss the plot here. Canada's economy was much stronger in Q1 than the BoC anticipated coming into the start of the year. Macklem was saying that the worst pain would be felt over 2024H1 and the January MPR forecast only +0.5% q/q SAAR GDP growth in Q1 that they then revised to 2.8% in the April MPR.
With the aforementioned caveat that this is using monthly production-side data, GDP is tracking somewhere around two percentage points faster than the BoC expected coming into the start of the year. We can't tell just yet how the BoC's forecast is tracking using identical sets of accounts, but it's probably in the ball park of their April forecast pending much more data yet to come for Q1.
Macklem also seemed dismissive toward the Q1 rebound when he recently pinned it on the end of the public sector strike in Quebec. That’s just silly. December GDP was down by just –0.1% m/m SA and the post-strike rebound of 0.5% m/m in January and then another 0.15% in February was much more powerful than the hit in December.
Overall I remain concerned about the Governor’s reaction function. He was very focused upon pushing the maximum employment experiment while ignoring evident inflation risk earlier in the pandemic era. He then reacted too late and raised rates probably higher than would have been needed had he acted earlier. He then went on pause in January of last year only to have to come back with more hikes in June and July. Now after just three soft months of core inflation he’s ready to pull out the pom poms and cut. Fading inflation risk on the upswing and celebrating such limited disinflationary evidence so soon is clear evidence that the Governor is a dove at heart and, in my opinion, not as serious about sustainably achieving 2% inflation as he ought to be.
What’s Next?
Ok so tick the GDP box. On the path to the June 5th BoC statement and presser we still face high data and event risk that could inform the decision. The partial list includes:
- tomorrow's FOMC statement/presser
- jobs/wages next Friday (off-cycle to the US this month)
- April's home sales on May 15th
- CPI for April on May 21st incorporating higher gas prices and carbon taxes and risk of pass through
- retail sales March on May 24th
- Q1 GDP on May 31st.
Onto the Fed.
DISCLAIMER
This report has been prepared by Scotiabank Economics as a resource for the clients of Scotiabank. Opinions, estimates and projections contained herein are our own as of the date hereof and are subject to change without notice. The information and opinions contained herein have been compiled or arrived at from sources believed reliable but no representation or warranty, express or implied, is made as to their accuracy or completeness. Neither Scotiabank nor any of its officers, directors, partners, employees or affiliates accepts any liability whatsoever for any direct or consequential loss arising from any use of this report or its contents.
These reports are provided to you for informational purposes only. This report is not, and is not constructed as, an offer to sell or solicitation of any offer to buy any financial instrument, nor shall this report be construed as an opinion as to whether you should enter into any swap or trading strategy involving a swap or any other transaction. The information contained in this report is not intended to be, and does not constitute, a recommendation of a swap or trading strategy involving a swap within the meaning of U.S. Commodity Futures Trading Commission Regulation 23.434 and Appendix A thereto. This material is not intended to be individually tailored to your needs or characteristics and should not be viewed as a “call to action” or suggestion that you enter into a swap or trading strategy involving a swap or any other transaction. Scotiabank may engage in transactions in a manner inconsistent with the views discussed this report and may have positions, or be in the process of acquiring or disposing of positions, referred to in this report.
Scotiabank, its affiliates and any of their respective officers, directors and employees may from time to time take positions in currencies, act as managers, co-managers or underwriters of a public offering or act as principals or agents, deal in, own or act as market makers or advisors, brokers or commercial and/or investment bankers in relation to securities or related derivatives. As a result of these actions, Scotiabank may receive remuneration. All Scotiabank products and services are subject to the terms of applicable agreements and local regulations. Officers, directors and employees of Scotiabank and its affiliates may serve as directors of corporations.
Any securities discussed in this report may not be suitable for all investors. Scotiabank recommends that investors independently evaluate any issuer and security discussed in this report, and consult with any advisors they deem necessary prior to making any investment.
This report and all information, opinions and conclusions contained in it are protected by copyright. This information may not be reproduced without the prior express written consent of Scotiabank.
™ Trademark of The Bank of Nova Scotia. Used under license, where applicable.
Scotiabank, together with “Global Banking and Markets”, is a marketing name for the global corporate and investment banking and capital markets businesses of The Bank of Nova Scotia and certain of its affiliates in the countries where they operate, including; Scotiabank Europe plc; Scotiabank (Ireland) Designated Activity Company; Scotiabank Inverlat S.A., Institución de Banca Múltiple, Grupo Financiero Scotiabank Inverlat, Scotia Inverlat Casa de Bolsa, S.A. de C.V., Grupo Financiero Scotiabank Inverlat, Scotia Inverlat Derivados S.A. de C.V. – all members of the Scotiabank group and authorized users of the Scotiabank mark. The Bank of Nova Scotia is incorporated in Canada with limited liability and is authorised and regulated by the Office of the Superintendent of Financial Institutions Canada. The Bank of Nova Scotia is authorized by the UK Prudential Regulation Authority and is subject to regulation by the UK Financial Conduct Authority and limited regulation by the UK Prudential Regulation Authority. Details about the extent of The Bank of Nova Scotia's regulation by the UK Prudential Regulation Authority are available from us on request. Scotiabank Europe plc is authorized by the UK Prudential Regulation Authority and regulated by the UK Financial Conduct Authority and the UK Prudential Regulation Authority.
Scotiabank Inverlat, S.A., Scotia Inverlat Casa de Bolsa, S.A. de C.V, Grupo Financiero Scotiabank Inverlat, and Scotia Inverlat Derivados, S.A. de C.V., are each authorized and regulated by the Mexican financial authorities.
Not all products and services are offered in all jurisdictions. Services described are available in jurisdictions where permitted by law.